In this tutorial, you will learn how to perform connected component labeling and analysis with OpenCV. Specifically, we will focus on OpenCV’s most used connected component labeling function, cv2.connectedComponentsWithStats.
Connected component labeling (also known as connected component analysis, blob extraction, or region labeling) is an algorithmic application of graph theory used to determine the connectivity of “blob”-like regions in a binary image.
We often use connected component analysis in the same situations that contours are used; however, connected component labeling can often give us more granular filtering of the blobs in a binary image.
When using contour analysis, we are often restricted by the hierarchy of the outlines (i.e., one contour contained within another). With connected component analysis, we can more easily segment and analyze these structures.
A great example of connected component analysis is computing the connected components of a binary (i.e., thresholded) license plate image and filtering the blobs based on their properties (e.g., width, height, area, solidity, etc.). This is exactly what we’ll be doing here today.
Connected component analysis is another tool to add to your OpenCV toolbelt!
To learn how to perform connected component labeling and analysis with OpenCV, just keep reading.
OpenCV Connected Component Labeling and Analysis
In the first part of this tutorial, we’ll review the four (yes, four) functions OpenCV provides to perform connected component analysis. The most popular of these functions is cv2.connectedComponentsWithStats.
From there, we’ll configure our development environment and review our project directory structure.
Next, we’ll implement two forms of connected component analysis:
- The first method will demonstrate how to use OpenCV’s connected component analysis function, compute statistics for each component, and then extract/visualize each of the components individually.
- The second method shows a practical, real-world example of connecting component analysis. We threshold a license plate and then use connected component analysis to extract just the license plate characters.
We’ll wrap up this guide with a discussion of our results.
OpenCV’s connected component functions

OpenCV provides four connected component analysis functions:
cv2.connectedComponentscv2.connectedComponentsWithStatscv2.connectedComponentsWithAlgorithmcv2.connectedComponentsWithStatsWithAlgorithm
The most popular method is cv2.connectedComponentsWithStats which returns the following information:
- The bounding box of the connected component
- The area (in pixels) of the component
- The centroid/center (x, y)-coordinates of the component
The first method, cv2.connectedComponents, is the same as the second, only it does not return the above statistical information. In the vast majority of situations, you will need the stats, so it’s worth simply using cv2.connectedComponentsWithStats instead.
The third method, cv2.connectedComponentsWithAlgorithm, implements faster, more efficient algorithms for connected component analysis.
If you have OpenCV compiled with parallel processing support then both cv2.connectedComponentsWithAlgorithm and cv2.connectedComponentsWithStatsWithAlgorithm will run faster than the first two.
But in general, stick with cv2.connectedComponentsWithStats until you are comfortable working with connected component labeling.
Configuring your development environment
To learn how to perform connected component analysis, you need to have OpenCV installed on your machine:
Luckily, OpenCV is pip-installable:
$ pip install opencv-contrib-python
If you need help configuring your development environment for OpenCV, I highly recommend that you read my pip install OpenCV guide — it will have you up and running in a matter of minutes.
Having problems configuring your development environment?
All that said, are you:
- Short on time?
- Learning on your employer’s administratively locked system?
- Wanting to skip the hassle of fighting with the command line, package managers, and virtual environments?
- Ready to run the code right now on your Windows, macOS, or Linux systems?
Then join PyImageSearch Plus today!
Gain access to Jupyter Notebooks for this tutorial and other PyImageSearch guides that are pre-configured to run on Google Colab’s ecosystem right in your web browser! No installation required.
And best of all, these Jupyter Notebooks will run on Windows, macOS, and Linux!
Project structure
Before we implement connected component analysis with OpenCV, let’s first take a peek at our project directory structure.
Start by accessing the “Downloads” section of this tutorial to retrieve the source code and example image:
$ tree . --dirsfirst
.
├── basic_connected_components.py
├── filtering_connected_components.py
└── license_plate.png

0 directories, 3 files
We’ll be applying connected component analysis to automatically filter out characters from a license plate (license_plate.png).
To accomplish this task and to learn more about connected component analysis, we’ll implement two Python scripts:
basic_connected_components.py: Demonstrates how to apply connected component labeling, extract each of the components and their statistics, and visualize them on our screen.filtering_connected_components.py: Applies connected component analysis but filters out non-license plate characters by examining each component’s width, height, and area (in pixels).
Implementing basic connected components with OpenCV
Let’s get started implementing connected component analysis with OpenCV.
Open up the basic_connected_components.py file in your project folder, and let’s get to work:
# import the necessary packages
import argparse
import cv2

# construct the argument parser and parse the arguments
ap = argparse.ArgumentParser()
ap.add_argument("-i", "--image", required=True,
	help="path to input image")
ap.add_argument("-c", "--connectivity", type=int, default=4,
	help="connectivity for connected component analysis")
args = vars(ap.parse_args())
Lines 2 and 3 import our required Python packages while Lines 6-11 parse our command line arguments.
We have two command line arguments:
--image: The path to our input image residing on disk.--connectivity: Either4or8connectivity (you can refer to this page for more details on four versus eight connectivity).
Let’s move on to preprocessing our input image:
# load the input image from disk, convert it to grayscale, and
# threshold it
image = cv2.imread(args["image"])
gray = cv2.cvtColor(image, cv2.COLOR_BGR2GRAY)
thresh = cv2.threshold(gray, 0, 255,
	cv2.THRESH_BINARY_INV | cv2.THRESH_OTSU)[1]
Lines 15-18 proceed to:
- Load our input
imagefrom disk - Convert it to grayscale
- Threshold it using Otsu’s thresholding method
After thresholding, our image will look like the following:

Notice how the license plate characters appear as white on a black background. However, there is also a bunch of noise in the input image that appears as foreground too.
Our goal is to apply connected component analysis to filter out these noise regions, leaving us with just the license plate characters.
But before we can get to that, let’s first learn how to use the cv2.connectedComponentsWithStats function:
# apply connected component analysis to the thresholded image
output = cv2.connectedComponentsWithStats(
	thresh, args["connectivity"], cv2.CV_32S)
(numLabels, labels, stats, centroids) = output
A call to cv2.connectedComponentsWithStats on Lines 21 and 22 performs connected component analysis with OpenCV. We pass in three arguments here:
- The binary
threshimage - The
--connectivitycommand line argument - The data type (which you should leave as
cv2.CV_32S)
The cv2.connectedComponentsWithStats then returns a 4-tuple of:
- The total number of unique labels (i.e., number of total components) that were detected
- A mask named
labelshas the same spatial dimensions as our inputthreshimage. For each location inlabels, we have an integer ID value that corresponds to the connected component where the pixel belongs. You’ll learn how to filter thelabelsmatrix later in this section. stats: Statistics on each connected component, including the bounding box coordinates and area (in pixels).- The
centroids(i.e., center) (x, y)-coordinates of each connected component.
Let’s learn how to parse these values now:
# loop over the number of unique connected component labels
for i in range(0, numLabels):
	# if this is the first component then we examine the
	# *background* (typically we would just ignore this
	# component in our loop)
	if i == 0:
		text = "examining component {}/{} (background)".format(
			i + 1, numLabels)

	# otherwise, we are examining an actual connected component
	else:
		text = "examining component {}/{}".format( i + 1, numLabels)

	# print a status message update for the current connected
	# component
	print("[INFO] {}".format(text))

	# extract the connected component statistics and centroid for
	# the current label
	x = stats[i, cv2.CC_STAT_LEFT]
	y = stats[i, cv2.CC_STAT_TOP]
	w = stats[i, cv2.CC_STAT_WIDTH]
	h = stats[i, cv2.CC_STAT_HEIGHT]
	area = stats[i, cv2.CC_STAT_AREA]
	(cX, cY) = centroids[i]
Line 26 loops over the IDs of all unique connected components returned by OpenCV.
We then encounter an if/else statement:
- The first connected component, with an ID of
0, is always the background. We typically ignore the background, but if you ever need it, keep in mind that ID0contains it. - Otherwise, if
i > 0, then we know the component is worth exploring more.
Lines 44-49 show us how to parse our stats and centroids lists, allowing us to extract:
- The starting
xcoordinate of the component - The starting
ycoordinate of the component - The width (
w) of the component - The height (
h) of the component - The centroid (x, y)-coordinates of the component
Let’s now visualize the bounding box and centroid of the current component:
	# clone our original image (so we can draw on it) and then draw
	# a bounding box surrounding the connected component along with
	# a circle corresponding to the centroid
	output = image.copy()
	cv2.rectangle(output, (x, y), (x + w, y + h), (0, 255, 0), 3)
	cv2.circle(output, (int(cX), int(cY)), 4, (0, 0, 255), -1)
Line 54 creates an output image that we can draw on. We then draw the bounding box of the component as a green rectangle (Line 55) and the centroid as a red circle (Line 56).
Our final code block demonstrates how to create a mask for the current connected component:
	# construct a mask for the current connected component by
	# finding a pixels in the labels array that have the current
	# connected component ID
	componentMask = (labels == i).astype("uint8") * 255

	# show our output image and connected component mask
	cv2.imshow("Output", output)
	cv2.imshow("Connected Component", componentMask)
	cv2.waitKey(0)
Line 61 first finds all locations in labels equal to the current component ID, i. We then convert the result to an unsigned 8-bit integer with a value of 0 for the background and a value of 255 for the foreground.
The output image and componentMask are then displayed on our screen on Lines 64-66.
OpenCV connected component analysis results
We are now ready to perform connected component labeling with OpenCV!
Be sure to access the “Downloads” section of this tutorial to retrieve the source code and example image:
$ python basic_connected_components.py --image license_plate.png
[INFO] examining component 1/17 (background)
[INFO] examining component 2/17
[INFO] examining component 3/17
[INFO] examining component 4/17
[INFO] examining component 5/17
[INFO] examining component 6/17
[INFO] examining component 7/17
[INFO] examining component 8/17
[INFO] examining component 9/17
[INFO] examining component 10/17
[INFO] examining component 11/17
[INFO] examining component 12/17
[INFO] examining component 13/17
[INFO] examining component 14/17
[INFO] examining component 15/17
[INFO] examining component 16/17
[INFO] examining component 17/17
The animation below shows me cycling through each of the 17 detected components:

The first connected component is actually our background. We typically skip this component as the background isn’t often needed.
The rest of the 16 components are then displayed. For each component, we draw the bounding box (green rectangle) and centroid/center (red circle).
You may have noticed that some of these connected components are license plate characters while others are simply “noise.”
That raises the question:
Is it possible to detect just the license plate characters’ components? And if so, how do we do that?
We’ll address that question in the next section.
How to filter connected components with OpenCV
Our previous code example demonstrated how to extract connected components with OpenCV, but it didn’t demonstrate how to filter them.
Let’s learn how we can filter connected components now:
# import the necessary packages
import numpy as np
import argparse
import cv2

# construct the argument parser and parse the arguments
ap = argparse.ArgumentParser()
ap.add_argument("-i", "--image", required=True,
	help="path to input image")
ap.add_argument("-c", "--connectivity", type=int, default=4,
	help="connectivity for connected component analysis")
args = vars(ap.parse_args())
Lines 2-4 import our required Python packages while Lines 7-12 parse our command line arguments.
These command line arguments are identical to the ones from our previous script, so I suggest you refer to earlier in this tutorial for a detailed explanation of them.
From there, we load our image, preprocess it, and apply connected component analysis:
# load the input image from disk, convert it to grayscale, and
# threshold it
image = cv2.imread(args["image"])
gray = cv2.cvtColor(image, cv2.COLOR_BGR2GRAY)
thresh = cv2.threshold(gray, 0, 255,
	cv2.THRESH_BINARY_INV | cv2.THRESH_OTSU)[1]

# apply connected component analysis to the thresholded image
output = cv2.connectedComponentsWithStats(
	thresh, args["connectivity"], cv2.CV_32S)
(numLabels, labels, stats, centroids) = output

# initialize an output mask to store all characters parsed from
# the license plate
mask = np.zeros(gray.shape, dtype="uint8")
Lines 16-19 load our input image and preprocess it in the same manner as we did in our previous script. We then apply connected component analysis on Lines 22-24.
Line 28 initializes an output mask to store all license plate characters we have found after performing connected component analysis.
Speaking of which, let’s loop over each of the unique labels now:
# loop over the number of unique connected component labels, skipping
# over the first label (as label zero is the background)
for i in range(1, numLabels):
	# extract the connected component statistics for the current
	# label
	x = stats[i, cv2.CC_STAT_LEFT]
	y = stats[i, cv2.CC_STAT_TOP]
	w = stats[i, cv2.CC_STAT_WIDTH]
	h = stats[i, cv2.CC_STAT_HEIGHT]
	area = stats[i, cv2.CC_STAT_AREA]
Notice that our for loop starts from ID 1, implying that we are skipping over 0, our background value.
We then extract the bounding box coordinates and area of the current connected component on Lines 35-39.
We are now ready to filter our connected components:
	# ensure the width, height, and area are all neither too small
	# nor too big
	keepWidth = w > 5 and w < 50
	keepHeight = h > 45 and h < 65
	keepArea = area > 500 and area < 1500

	# ensure the connected component we are examining passes all
	# three tests
	if all((keepWidth, keepHeight, keepArea)):
		# construct a mask for the current connected component and
		# then take the bitwise OR with the mask
		print("[INFO] keeping connected component '{}'".format(i))
		componentMask = (labels == i).astype("uint8") * 255
		mask = cv2.bitwise_or(mask, componentMask)
Lines 43-45 demonstrate that we are filtering our connected components based on their width, height, and area, discarding components that are either too small or too large.
Note: Wondering how I came up with these values? I used print statements to show the width, height, and area for each connected component while visualizing them individually to my screen. I noted the width, height, and area for the license plate characters and found their minimum/maximum values, with a bit of tolerance on each end. You should do the same for your own applications.
Line 49 verifies that keepWidth, keepHeight, and keepArea are all True, implying that each of them passed the test.
If that’s indeed the case, we compute the componentMask for the current label ID (just like we did in our basic_connected_components.py script) and add the license plate character to our mask.
Finally, we display our input image and output license plate characters mask on our screen.
# show the original input image and the mask for the license plate
# characters
cv2.imshow("Image", image)
cv2.imshow("Characters", mask)
cv2.waitKey(0)
As we’ll see in the next section, our mask will only contain the license plate characters.
Filtering connected components results
Let’s learn how to filter connected components with OpenCV!
Be sure to access the “Downloads” section of this guide to retrieve the source code and example image — from there, you can execute the following command:
$ python filtering_connected_components.py --image license_plate.png
[INFO] keeping connected component 7
[INFO] keeping connected component 8
[INFO] keeping connected component 9
[INFO] keeping connected component 10
[INFO] keeping connected component 11
[INFO] keeping connected component 12
[INFO] keeping connected component 13

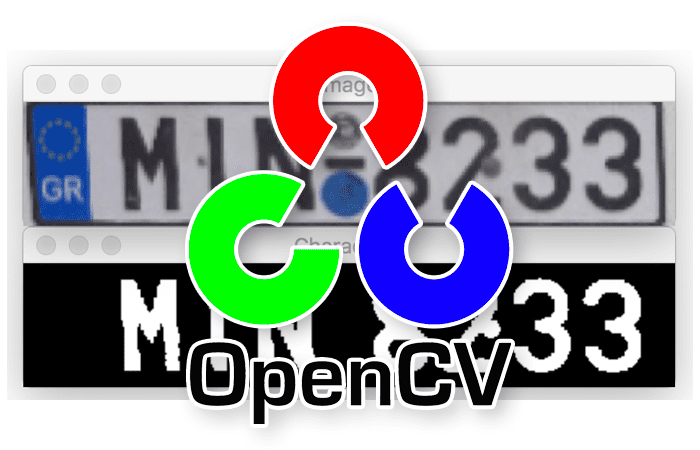
Figure 5 displays the results of filtering our connected components. On the top, we have our original input image containing the license plate. The bottom has the results of filtering the connected components, resulting in just the license plate characters themselves.
If we were building an Automatic License/Number Plate Recognition (ALPR/ANPR) system, we would take these characters and then pass them into an Optical Character Recognition (OCR) algorithm for recognition. But all of that hinges on us being able to binarize the characters and extract them, which connected component analysis enabled us to do!
What’s next?

Are you ready to run the code for yourself?
Join PyImageSearch Plus and get access to Jupyter Notebooks for this tutorial and other PyImageSearch guides that are pre-configured to run on Google Colab’s ecosystem right in your web browser. No installation required.
In fact, you’ll get high-quality source code, Jupyter Notebooks, and video tutorials for all 400+ PyImageSearch blog posts.
If you like the hands-on approach of this blog post, you’ll love my weekly training videos inside PyImageSearch Plus.
In-depth training on computer vision, deep learning, and OpenCV like this isn’t available anywhere else online.
I’m a PhD with 10 years of experience in the field. Every tutorial you find here is practical and hands-on. You don’t just learn the algorithms behind computer vision, you can also watch as I implement and explain them all line by line.
You’ll understand what is going on, how we’re implementing the algorithm, and why we’re doing it that way.
Plus – you’ll get the opportunity to learn advanced computer vision and deep learning techniques as well.
Best of all, you’ll learn how to build computer vision pipelines so you can implement them in your own projects and research.
Join PyImageSearch Plus and get practical, hands-on learning about computer vision and deep learning. And it’s fun, too!
See you on the other side!
Summary
In this tutorial, you learned how to perform connected component analysis.
OpenCV provides us with four functions for connected component labeling:
cv2.connectedComponentscv2.connectedComponentsWithStatscv2.connectedComponentsWithAlgorithmcv2.connectedComponentsWithStatsWithAlgorithm()
The most popular of which is the cv2.connectedComponentsWithStats function we used today.
When dealing with blob-like structures in your images, connected component analysis can actually replace the process of contour detection, computing statistics over the contours, and filtering them.
Connected component analysis is a handy function to have in your toolbelt, so be sure you get some practice using it.
To download the source code to this post (and be notified when future tutorials are published here on PyImageSearch), simply enter your email address in the form below!
Download the Source Code and FREE 17-page Resource Guide
Enter your email address below to get a .zip of the code and a FREE 17-page Resource Guide on Computer Vision, OpenCV, and Deep Learning. Inside you'll find my hand-picked tutorials, books, courses, and libraries to help you master CV and DL!
The post OpenCV Connected Component Labeling and Analysis appeared first on PyImageSearch.